|
Cidade |
Regiao |
Cid_reg |
Habitantes |
IDH |
Rend_Cap |
Cap_Empr |
Teci_Emr |
Gov_Descn |
Org_Prod |
Ins_Compet |
Edu_Empr |
|
Piracicaba |
SE |
Pir_SE |
439 |
0,785 |
1,14 |
0,54 |
0,695 |
0,796 |
0,598 |
0,761 |
0,004 |
|
Sao_Car |
SE |
SC_SE |
252 |
0,805 |
1,08 |
0,686 |
0,653 |
0,812 |
0,564 |
0,788 |
0,002 |
|
Sao_Jose |
SE |
SJ_SE |
461 |
0,797 |
1,17 |
0,613 |
0,73 |
0,648 |
0,597 |
0,769 |
0,011 |
|
Mon_Clar |
SE |
MC_SE |
409 |
0,77 |
0,65 |
0,481 |
0,651 |
0,696 |
0,549 |
0,666 |
0,124 |
|
Rondono |
CO |
Ron_CO |
232 |
0,755 |
0,84 |
0,452 |
0,509 |
0,626 |
0,567 |
0,651 |
0 |
|
Anápolis |
CO |
Aná_CO |
387 |
0,737 |
0,79 |
0,481 |
0,645 |
0,695 |
0,562 |
0,708 |
0 |
|
Camp_Gra |
NE |
CG_NE |
410 |
0,72 |
0,63 |
0,458 |
0,565 |
0,683 |
0,571 |
0,59 |
0,584 |
|
Petroli |
NE |
Pet_NE |
349 |
0,697 |
0,61 |
0,419 |
0,43 |
0,678 |
0,528 |
0,57 |
0,009 |
|
Rio_Bran |
Norte |
RB_Norte |
407 |
0,727 |
0,74 |
0,342 |
0,47 |
0,663 |
0,486 |
0,503 |
0,0009 |
|
Boa_Vista |
Norte |
BV_Norte |
399 |
0,752 |
0,79 |
0,338 |
0,458 |
0,538 |
0,502 |
0,585 |
0,082 |
|
Maringa |
S |
Mar_S |
424 |
0,808 |
1,2 |
0,652 |
0,753 |
0,791 |
0,611 |
0,765 |
0,01 |
|
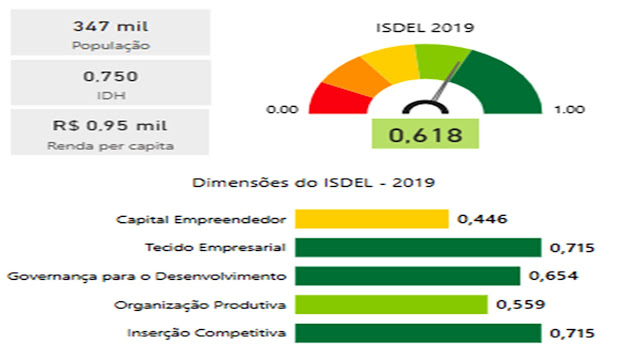
Cax_Sul |
S |
CS_S |
347 |
0,75 |
0,95 |
0,446 |
0,715 |
0,654 |
0,559 |
0,715 |
0,046 |
|
|
|
Kruskal
Wallis |
NS |
* |
* |
* |
* |
NS |
* |
* |
NS |
Inteligência artificial indutiva (Machine Learning) não supervisionada para classificação - Cluster analysis
Cluster e Dendrograma de todas as cidades, programa SAS: ver banco de dados
data cidades;
input Cid_reg $ IDH Rend_Cap Cap_Empr Teci_Emr Org_Prod Ins_Comp;
cards;
Pir_SE 0.785 1.14 0.54 0.695 0.598 0.761
SC_SE 0.805 1.08 0.686 0.653 0.564 0.788
SJ_SE 0.797 1.17 0.613 0.73 0.597 0.769
MC_SE 0.77 0.65 0.481 0.651 0.549 0.666
Ron_CO 0.755 0.84 0.452 0.509 0.567 0.651
Ana_CO 0.737 0.79 0.481 0.645 0.562 0.708
CG_NE 0.72 0.63 0.458 0.565 0.571 0.59
Pet_NE 0.697 0.61 0.419 0.43 0.528 0.57
RB_Norte 0.727 0.74 0.342 0.47 0.486 0.503
BV_Norte 0.752 0.79 0.338 0.458 0.502 0.585
Mar_S 0.808 1.2 0.652 0.753 0.611 0.765
CS_S 0.75 0.95 0.446 0.715 0.559 0.715
;
proc print;
run;
proc cluster data=cidades outtree = arvore method = average;
var IDH Rend_Cap Cap_Empr Teci_Emr Org_Prod Ins_Comp;
id Cid_reg;
run;
PROC TREE DATA = arvore;
RUN;
Cluster e Dendrograma de todas as regiões e
Piracicaba, programa SAS:
data regioes;
input Local
$ IDH Rend_Cap Cap_Empr Teci_Emr Org_Prod Ins_Compet;
cards;
CO 0.746
0.815 0.4665 0.577 0.5645 0.6795
NE 0.7085
0.62 0.4385 0.4975 0.5495 0.58
Norte
0.7395 0.765 0.34 0.464 0.494 0.544
S 0.779
1.075 0.549 0.734 0.585 0.74
SE 0.78925
1.01 0.58 0.68225 0.577 0.746
Piracic
0.785 1.14 0.54 0.695 0.598 0.761
;
proc print;
run;
proc
cluster outtree = arvore method = average;
var IDH
Rend_Cap Cap_Empr Teci_Emr Org_Prod Ins_Compet;
id Local;
run;
PROC TREE
DATA = arvore;
RUN;


Nenhum comentário:
Postar um comentário